
by Kelly Dittmar, Ph.D.
In this post, we take a first look at women running for state legislative seats in 2016. The detail and predictability of our data is limited at this level due to the high number of candidates and races, but our outlook shows that we enter Election Day with a record-level number of female state legislative nominees, with enough poised to win that we expect an increase in women’s state legislative representation in 2017.
State Legislative Nominees
In 2016, 2602 women are state legislative nominees in the 44 states holding state legislative elections, marking a new record.[1] This number only includes major party nominees (1702D, 891R), non-partisan nominees in Nebraska (5), and third-party nominees who are incumbents (4 independents). This year, 482 (297D, 180R, 5NP) women are nominees for state senate seats and 2120 (1405D, 711R, 4I) are nominees for state house seats.
Three hundred and two (192D, 105R, 4NP, 1I) additional women are holdovers that are guaranteed seats in 2017. The highest number of women nominees for state legislative seats since CAWP began tracking these numbers was 2537, set in 2010 – a year in which 46 states held legislative elections.[2] Thus, even in a year where fewer state legislative seats are being contested, more women will be on the ballot.
Total Women Nominees and Winners for State Legislatures, 1976-2016
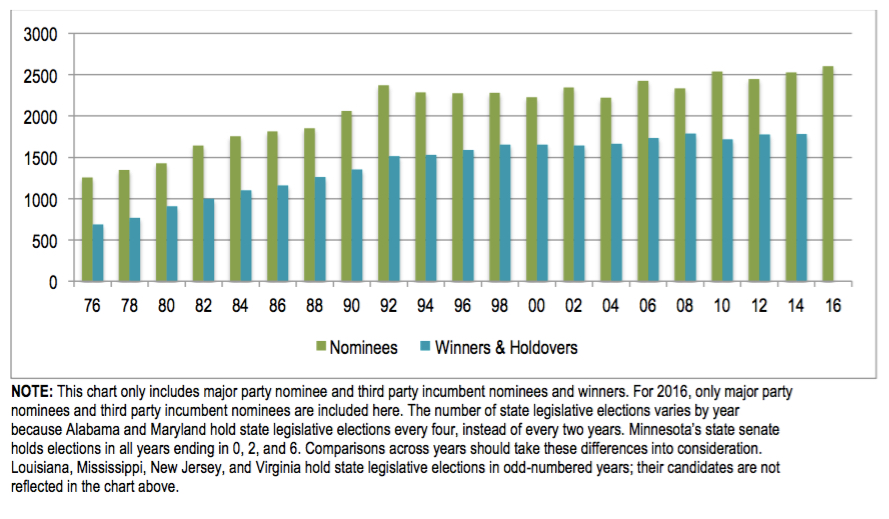
Of the 2602 women nominees running this year, 1208, or 46.4%, are incumbents. Seven hundred and fifty-seven women, or 29.1%, are running as challengers and 637 women, or 24.5%, are running in open seat contests. Among female state house nominees, 46.2% are running as incumbents, 30% are running as challengers, and 24.8% are running in open seat contests. Among female state senate nominees, 47.5% are incumbents, 29.4% are running as challengers, and 23% are running in open seat contests.
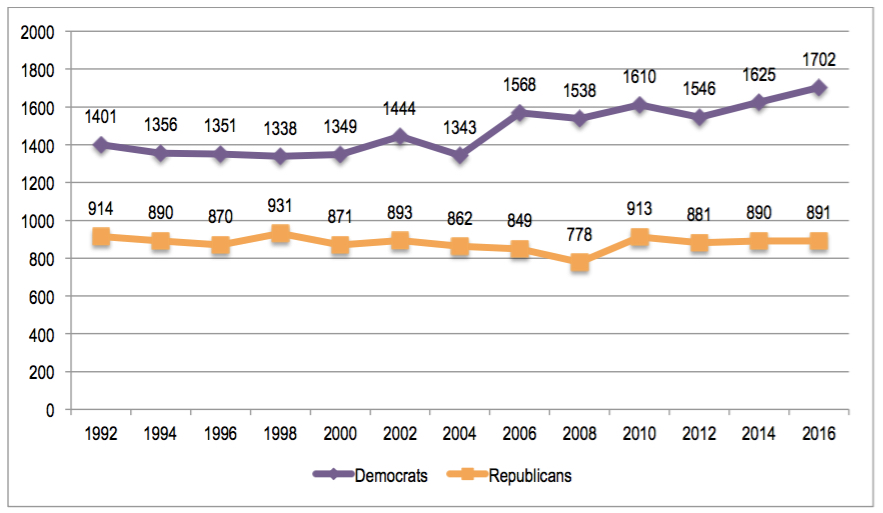
The number of Democratic women state legislative nominees in 2016 (1702) is the greatest we’ve recorded, up from the previous high of 1625 in election 2014. The number of Republican women nominated this year (891) is up only one from the number on the ballot in 2014 (890). This does not mark a record high for Republican women state legislative nominees since we began tracking these numbers in 1992.
While the overall trend between and across parties is one of relative stasis, as is evident in the flat lines in the graphs above and below, the increase in Democratic women nominees this year may foreshadow a more significant increase in women’s state legislative representation in 2017.
Total Major Party Women Nominees for State Legislatures, 1992-2016
Women in State Legislatures 2017
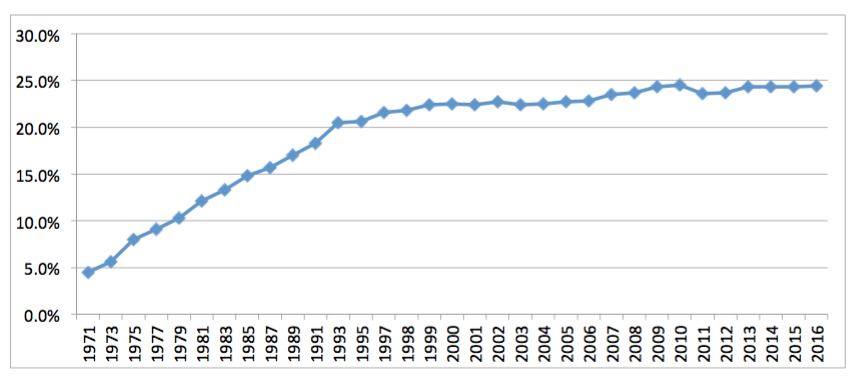
Today, 1805 (1081D, 705R, 11NP, 7I) women serve in state legislatures, including 442 (263D, 167R, 11NP, 1I) female state senators and 1363 (819D, 538R, 6I) female members of state houses. They represent 24.4% of all 7383 state legislators nationwide. The percentage of women state legislators has remained nearly flat over the past two decades, as is evident in the line graph below. As the chart above shows, women’s state legislative representation increases as the number of women nominees rises. With a rising number of women nominees this year, we should see an increase in women’s state legislative representation.
Percent of Women State Legislators, 1971-2014
Currently, 398 (367D, 30R, 1NP) women state legislators, or 21.9% of all women legislators, are women of color. Because we are unable to track the race of state legislative candidates prior to Election Day, we do not know the racial identification and breakdown of women nominees this year.
CAWP will be tracking the numbers of women winning state legislative seats on Election Day to determine how women fare nationally, by chamber, by state, and by party. We will monitor trends in women’s representation and watch for shifts in the balance of partisan power in state legislative chambers, especially where women hold top leadership positions.
[1] No state legislative elections will be held this year in AL, LA, MD, MS, NJ, and VA.
[2] Because AL and MD hold state legislative elections every four years and LA, MS, NJ, and VA hold state legislative elections in odd-numbered, only 44 states are holding state legislative elections this year. Minnesota’s state senate holds elections in all years ending in 0, 2, and 6.