Putting the Record Numbers of Women's Candidacies into Context
Just last week, we surpassed the record number for women candidates filed to run for the U.S. House of Representatives. As of April 6, 309 (231D, 78R) women filed in the 29 states where filing deadlines have passed and candidacies have been certified. The previous high for women primary candidates for the U.S. House was 298, set in 2012. With 21 states left to file or certify candidacies, the number of women candidates across this year’s U.S. House primaries will most certainly confirm predictions of a surge in women running.
Amidst the narratives of women’s surge in candidacies and political engagement being floated by organizations and news media, it’s hard to see these particular data on women House candidates in the appropriate context. Within that context, you’ll find that women remain underrepresented among all House candidates, despite increasing in number and proportion of candidacies from 2016 to 2018.
As of April 6, women are just 21.9% of the major party candidates that have filed for the U.S. House. This is the other half of the story in election 2018: the number of men running is also up, and male candidates still far outnumber women running for the House.
In the 2016 U.S. House elections, 17.8% of all of the candidates on primary ballots or successful in party conventions were women.* While these data reflect candidacies across all states and account for any filed candidates who withdrew before ballots were printed, they indicate that the proportion of women candidates – not just the number of women running – is up this year from the previous election cycle.
Another way to compare the data is to look only at 2016 House candidates only in the same states that have already filed and certified candidates in 2018. Women were 15.9% of primary candidates and convention winners in these states in 2016.
The data in the table below show that the number of filed candidates in these 29 states is up by nearly 40% from the number of primary candidates on 2016 ballots or successful at party conventions. That number masks an enormous gender gap; while the number of male candidates is up by about 28% in these states overall, the number of female candidates is nearly double – 90% more – what it was in 2016.
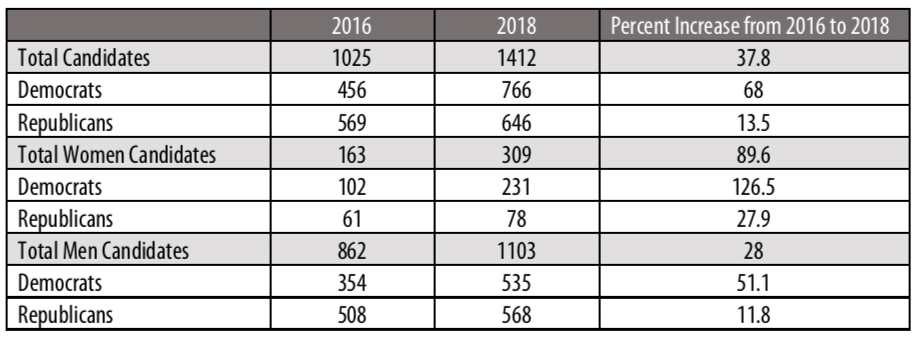
NOTE: 2016 data reflects the number of men and women candidates on primary ballots or successful in nominating conventions (where the conventions were held in lieu of a primary election). 2018 data reflects the number of men and women candidates who filed and whose candidacies were certified according to state election officials in the 29 states that completed certification by April 6, 2018.
Short answer: no. To start, 75% of the major party women candidates who have already filed for the U.S. House are Democrats. And the underrepresentation of Republican women is particularly stark when reported as a proportion of all filed Republican House candidates. As of April 6, just 12% of all filed Republican House candidates are women, while women are 30.2% of all Democrats filed to run for the House.
In a previous analysis, I made the point that the “pink wave” in 2018 hues blue, demonstrating how much of the increase in women House candidates this year is concentrated among Democrats. When focusing specifically on the states where candidates have already filed this year, this story remains true. Compared to 2016 numbers of candidates on primary ballots or winning conventions in the same states, Democratic candidacies are up by about 68% overall, by 51% among Democratic men, and by 126.5% among Democratic women. The increase in Republican women candidates (28%) is larger than among Republican men (12%) from 2016 to 2018, but overall the rise in candidacies among Republicans is minimal (13.5%) and unequal to that among Democrats running for the House in 2018.
CAWP’s Election Watch provides updated numbers of women candidates in real time, including breakdowns by filing status, candidate type (open seat contender, challenger, incumbent), party, and level of office. These data help to provide additional context to understand gender differences among 2018 candidacies, as do analyses that have shown that challengers make up a high proportion of women House candidates and that many women candidates are running in districts where members of their party are unlikely to win.
These details matter, not only for understanding what is happening in electoral politics today, but also for predicting and contextualizing what happens in November. Thus far in 2018, the House data show that the progress for women candidates is real but not universal, and that the push to gender parity in congressional elections – at least vis-a-vis candidate numbers – is far from over.
* The proportion of filed candidates today may not reflect the total candidates on primary ballots (the measure used for 2016 data) if any candidates withdraw before ballots are printed.